
CSIDB in 2025: a new “At a glance” dashboard, and a quieter (but productive) New Year
Every January I normally publish an annual “state of the database” write-up with charts and headline figures (last year’s post is a good example). This year, I’ve changed the format.
Instead of me picking a handful of stats and presenting them one way, CSIDB now has a new interactive dashboard on the homepage, so you can explore the data yourself — with your own filters — and click straight through to the underlying incidents.
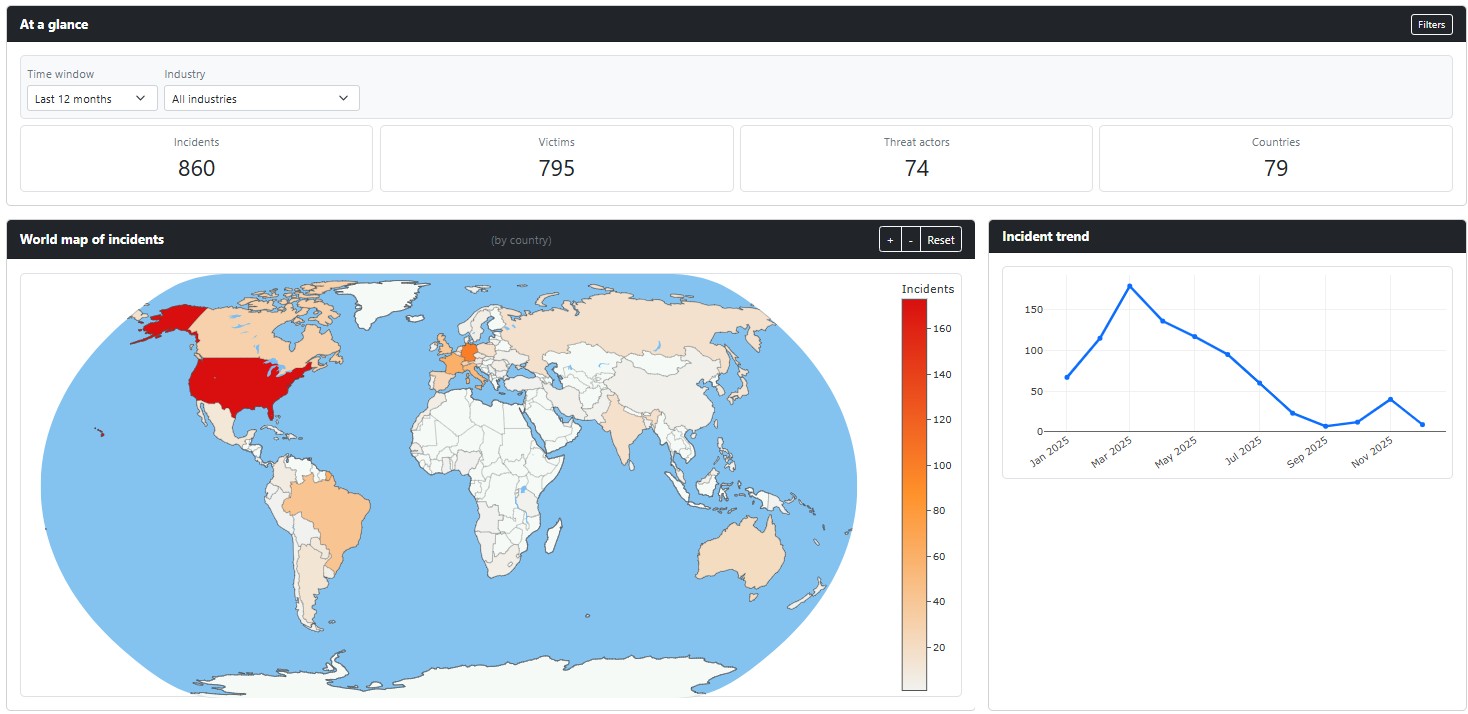
What’s new: the homepage dashboard
The dashboard is designed to answer the questions people ask most often, quickly:
- Filter by time window (e.g. Last 30 days / Last 90 days / Last 12 months / All time)
- Filter by industry (using the CSIDB/STIX-aligned sector list)
- See instant headline totals: Incidents, Victims, Threat Actors, Countries
- Visualise where incidents are happening (world map) and when they’re trending (incident trend chart)
- Browse the most recent incidents and jump into the full record
- Quickly sanity-check what’s active via top threat actors, top countries, and top industries for the selected filters
A quick snapshot
The dashboard is intentionally live and filter-driven, so the numbers will move over time as the dataset grows and entries are refined. If you’d like to include a snapshot in this post, you can simply copy the headline totals shown on the dashboard on the day you publish.
User-facing improvements beyond the dashboard
While the homepage dashboard is the biggest visible change, there were a few other improvements aimed at making CSIDB easier to use for regular visitors:
- Simpler onboarding: you can now sign up using LinkedIn, as well as the standard email flow.
- Clearer definitions and consistency: the Codebook remains the reference point for sector, motive, and threat-actor type definitions, so charts and filters are easier to interpret.
- Faster path from summary → detail: the dashboard’s “most recent incidents” list is built for scanning, then clicking through when something looks relevant.
Behind the scenes: quality and maintainability
I've also spent some time over the new year holidays strengthening the foundations: improving data quality workflows, and making it easier for CSIDB AI Agents to spot (and fix) duplicates and splits (mutliple victims stored as one victim object).
The goal is simple: keep the public site clean, navigable, and trustworthy — while still moving quickly on ingestion and enrichment.
Where this goes next
The dashboard is the first step towards making CSIDB’s stats self-serve: fewer static “once-a-year” charts, and more ability for visitors to answer their own questions in seconds.
If you’ve got ideas for new filters, additional “at a glance” panels, or different ways you’d like the trends presented, I’d love to hear them — and in the meantime, do have a play with the new homepage dashboard and see what you can discover.